TOMOGRAPHIC BRIGHT FIELD IMAGING (TBFI)
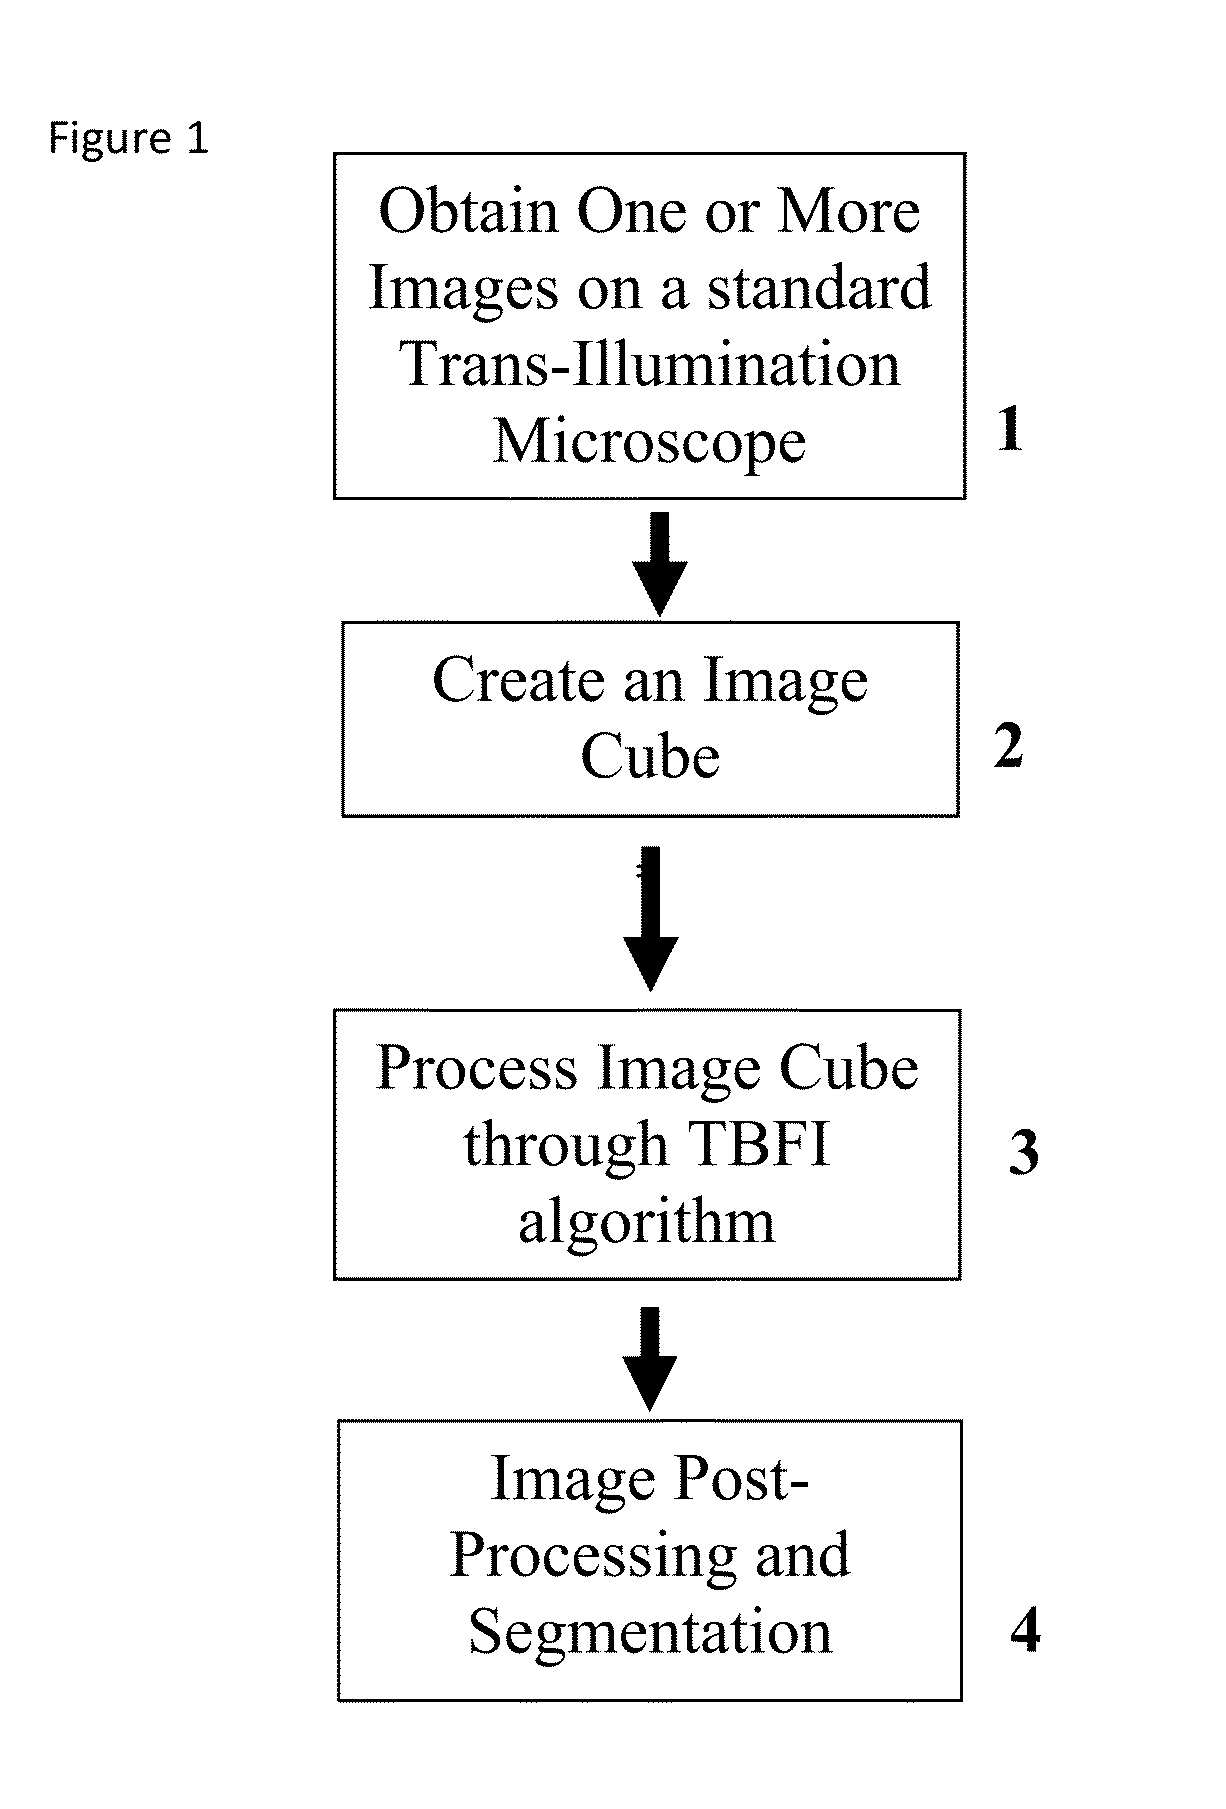
This invention was developed with the support of the United States government under the terms of grant numbers 5 U54 CA143906 and 1 R01 HL101972 awarded by the National Institutes of Health. The United States government has certain rights to this invention. Generally, the field involves imaging. More specifically the field involves phase contrast light microscopy in cellular imaging. The use of high magnification optical microscopy has become an indispensable resource in the investigation of cellular organisms. Owing to their low endogenous absorbance and weak scattering properties over the visible optical spectrum, cells primarily affect the phase of optical waves traveling through them and thus appear semitransparent when imaged with standard bright field microscopes. This fact has inspired the utilization of phase to enhance contrast in cellular imaging (e.g., phase contrast and differential interference contrast microscopy) and quantify cellular structure Preza C et al, in This is a result of the restriction of phase and cellular mass determination to custom built instruments (Wang et al, 2011 supra and Charrire F et al, Described herein is a method of tomographic bright field imaging (TBFI)—an optical imaging technique that enables the measurement of cellular refractive index and dry mass density using a standard transillumination optical microscope. TBFI is a technologically accessible label-free imaging modality capable of quantifying cellular refractive index, mass, volume, and density of multiple biological specimens simultaneously. TBFI is readily extended to live cell imaging to monitor growth dynamics over time, subcellular architecture, studies of sample dispersion properties (Subramanian H et al, In one example approach, the method involves creating or obtaining one or more image cubes, processing those image cubes using a transport of intensity equation and processing those image cubes using an eikonal equation. In other examples, the method involves measuring the intensity of light passing through a sample at a set of z-planes, so as to create a set of 2-D measurements of the sample. The 2-D measurements are then combined to form a 3-D image cube. The image cube is then processed using a TBFI algorithm comprising at least a transport of intensity equation (TIE) and an Eikonal equation. In other examples of the method, the TBFI algorithm further comprises a first convolution theorem. In those examples, processing results in a 3-D image cube of phase values. In other examples, the TBFI algorithm further comprises a relation to the refractive index and a second convolution theorem. In those examples, the processing results in a 3-D image cube of refractive index values. In still other examples, the TBFI algorithm further comprises a relation to the refractive index, a second convolution theorem and a calibration model. In those examples, the processing results in a 3-D image cube of mass density profile values. In additional examples, the method comprises post processing of the 3-D image cube by defining the borders of the 3-D image cube. The post processing may further comprise determining the volume of the sample, determining the dry mass density of the sample and/or determining the mass of the sample. In further examples, these are determined using equations (6) (8) and (9) described below. Also disclosed herein is software embodying any of the methods described herein. This Summary is provided to introduce a selection of concepts in a simplified form that are further described below in the Detailed Description. This Summary is not intended to identify key features or essential features of the claimed subject matter, nor is it intended to be used to limit the scope of the claimed subject matter. Furthermore, the claimed subject matter is not limited to implementations that solve any or all disadvantages noted in any part of this disclosure. The following detailed description is directed methods of tomographic bright field imaging (TBFI)—an optical imaging technique that enables the measurement of cellular refractive index and dry mass density using a standard transillumination optical microscope. In the following detailed description, reference is made to the accompanying drawings which form a part hereof, and in which are shown by way of illustration embodiments that may be practiced. It is to be understood that other embodiments may be utilized and structural or logical changes may be made without departing from the scope. Therefore, the following detailed description is not to be taken in a limiting sense, and the scope of embodiments is defined by the appended claims and their equivalents. Various operations may be described as multiple discrete operations in turn, in a manner that may be helpful in understanding embodiments; however, the order of description should not be construed to imply that these operations are order dependent. TBFI is an extension of quantitative noninterferometric propagation-based phase determination methods based on the transport of intensity equation (TIE) (Paganin D and Nugent K A, (NA=0.2) condenser lenses in a Köhler configuration with a narrow band color filter (λ=540 ±20 nm) placed in the illumination arm of the instrument. The TBFI method can also include an image acquisition and post-processing procedure: through focus bright field images, acquired with a charge coupled device (CCD) camera mounted on a standard microscope can serve as the input to the TBFI model from which the specimen refractive index and mass density are determined using a fast Fourier transform based numerical method. To develop the TBFI formalism, three dimensional coordinates (r⊥, z) were defined where z denotes the position along the optical axis and r⊥ the position within a plane normal to the optical axis. ∇⊥ is the gradient and Δ⊥ the Laplacian in r⊥ coordinates. Defining the wave field traversing the specimen by; where I is the intensity and φ the phase, the TIE is obtained by substituting U into the paraxial wave equation and taking the imaginary part of the resulting expression; the eikonal equation arises from the real terms. Letting k=2π/λ, the TIE is given by; with boundary conditions; I(r⊥, z)≧0 in L×D, and I(r⊥,z) =0 ∂L×∂X (Frank J, et al, 27 Denoting the trajectory of waves through the sample by the parametric curve {right arrow over (p)} (s), s ∈ [0, l], phase distortions induced in the wave field as the wave propagates from point {right arrow over (p)} (0)=(r0, z0) to {right arrow over (p)}(l)=(r⊥, z) can be related to the refractive index, n(r, z), of the specimen through solutions to the eikonal equation for phase; (Ishamaru A, The objective lens of the microscope images spherical waves emanating from the sample plane onto the CCD camera while plane waves are out of focus due to the Köhler illumination conditions. As a result, waves contributing to image formation do not propagate solely along the optical (z) axis; their deviation is slight enough however (as detailed by Mie theory and the Born approximation for weak index contrast systems) to satisfy the constraints of the PA. The optical sectioning of the sample, due to spatial frequency space filtration by the objective lens under the Bragg condition, ensures that phase contributions to the spherical waves leaving the sample plane are specific to that plane when imaged onto the CCD camera. Moreover, the waves contributing to image formation, ignoring out-of-focus contributions, can be considered as plane waves up to their interaction inside the focal volume of the objective lens. This is justified by the first order Born approximation in which weak index systems do not give rise to appreciable multiple scattering. Together, these properties enable the restriction of Eq. (2) to straight-line trajectories of wave energy along the optical axis through the sample: Letting (r0, z0) be the origin, swapping dummy variable s with z′, and taking the specimen to be located directly above the origin, hence φ(r0,z0)=0, for points inside the specimen we find φ(r⊥, z)=k ∫0zn(r⊥, z′)dz′. Substitution of this integral expression for phase into the TIE, followed by a subsequent differentiation in z yields the TBFI imaging model: an equation relating the measurable axial intensity variations to the refractive index of the sample In the development of this expression the identity was used (D. Paganin & K. A. Nugent, A solution for the refractive index was developed. Letting G denote the Green function of the Laplacian in 2, the refractive index has the formal representation; The numerical implementation of this formula can be carried out in a practical manner, via the convolution theorem, as the application of several two dimensional Fourier transforms, denoted by F: Through-focus intensity images are used to approximate the axial intensity derivatives appearing in Eq. (5) using finite differences. Here kxand kydenote the spatial frequency variables corresponding to the coordinates x and y, respectively. Low frequency noise contributions are eliminated by taking for kx,y=0. With the elimination of these “dc” frequency components, a knowledge of the ambient refractive index is required to set the absolute scale for the refractive index. The following examples are illustrative of disclosed methods. In light of this disclosure, those of skill in the art will recognize that variations of these examples and other examples of the disclosed method would be possible without undue experimentation. In Polystyrene spheres larger than 2.8 μm in diameter are difficult to reconstruct as diffraction effects nullify the paraxial TBFI model assumptions. However, in the central plane of larger objects in which diffraction effects are minimized, the refractive index can be reconstructed. In For biological applications on cellular specimens, the dry mass density, C [g/dL], can be inferred from the refractive index through a linear calibration model (Friebel M and Meinke M Appl Opt 45, 2838 (2006); incorporated by reference herein). α(λ) [dL/g] is the specific refractive increment of the cell solids: for nucleated cells α=0.002/nH To demonstrate the ability of TBFI to recover properties of biological specimens, we applied the technique, with the optimized axial increments from the sphere calibration, to the measurement of the mass, volume, and density of 20 red blood cells (RBCs) at X63 magnification. Peripheral blood was obtained from a healthy volunteer, dispersed onto a glass microscope slide and fixed with paraformaldehyde. A coverslip was mounted over the RBCs using fluoromount G. The mass and volume were then computed according to: As measured by TBFI, red blood cells were found to have an average refractive index of 1.402±0.008, (all quantities mean ±standard deviation), in keeping with Hb associated refractive index values at λ=540 nm reported in past studies, an average dry mass of 27.2 ±5.3, volume 100.7±17.9, and density 27.1 ±3.1 [pg/fL] (or [g/mL]); all within physiological norms (Lichtman M, Williams Hematology, McGraw Hill Professional, New York (2005); incorporated by reference herein.) In some embodiments, the above described methods and processes may be tied to a computing system, including one or more computers. In particular, the methods and processes described above with regard to Computing device 700 includes a logic subsystem 702 and a data-holding subsystem 704. Computing device 700 may optionally include a display subsystem 706 and a communication subsystem 708, and/or other components not shown in Logic subsystem 702 may include one or more physical devices configured to execute one or more machine-readable instructions. For example, the logic subsystem may be configured to execute one or more instructions that are part of one or more applications, services, programs, routines, libraries, objects, components, data structures, or other logical constructs. Such instructions may be implemented to perform a task, implement a data type, transform the state of one or more devices, or otherwise arrive at a desired result. The logic subsystem may include one or more processors that are configured to execute software instructions. For example, the one or more processors may comprise physical circuitry programmed to implements one or more steps of one or more methods described herein. Additionally or alternatively, the logic subsystem may include one or more hardware or firmware logic machines configured to execute hardware or firmware instructions. Processors of the logic subsystem may be single core or multicore, and the programs executed thereon may be configured for parallel or distributed processing. The logic subsystem may optionally include individual components that are distributed throughout two or more devices, which may be remotely located and/or configured for coordinated processing. One or more aspects of the logic subsystem may be virtualized and executed by remotely accessible networked computing devices configured in a cloud computing configuration. Data-holding subsystem 704 may include one or more physical, non-transitory devices configured to hold data and/or instructions executable by the logic subsystem to implement the herein described methods and processes. When such methods and processes are implemented, the state of data-holding subsystem 704 may be transformed (e.g., to hold different data). Data-holding subsystem 704 may include removable media and/or built-in devices. Data-holding subsystem 704 may include optical memory devices (e.g., CD, DVD, HD-DVD, Blu-Ray Disc, etc.), semiconductor memory devices (e.g., RAM, EPROM, EEPROM, etc.) and/or magnetic memory devices (e.g., hard disk drive, floppy disk drive, tape drive, MRAM, etc.), among others. Data-holding subsystem 704 may include devices with one or more of the following characteristics: volatile, nonvolatile, dynamic, static, read/write, read-only, random access, sequential access, location addressable, file addressable, and content addressable. In some embodiments, logic subsystem 702 and data-holding subsystem 704 may be integrated into one or more common devices, such as an application specific integrated circuit or a system on a chip. When included, display subsystem 706 may be used to present a visual representation of data held by data-holding subsystem 704. As the herein described methods and processes change the data held by the data-holding subsystem, and thus transform the state of the data-holding subsystem, the state of display subsystem 706 may likewise be transformed to visually represent changes in the underlying data. Display subsystem 706 may include one or more display devices utilizing virtually any type of technology. Such display devices may be combined with logic subsystem 702 and/or data-holding subsystem 704 in a shared enclosure, or such display devices may be peripheral display devices. In some embodiments, computing device 700 may additionally include an audio subsystem including one or more speakers which may be used to present audio representations of data held by data-holding subsystem 704. When included, imaging subsystem 706 may be used acquire and/or process any suitable image data from various sensors or imaging devices in communication with computing device 700. For example, imaging subsystem may be configured to acquire optical images from a transillumination optical microscope. Imaging subsystem 706 may be combined with logic subsystem 702 and/or data-holding subsystem 704 in a shared enclosure, or such imaging subsystems may comprise periphery imaging devices. Data received from the imaging subsystem may be held by data-holding subsystem 704. When included, communication subsystem 708 may be configured to communicatively couple computing device 700 with one or more other computing devices. Communication subsystem 708 may include wired and/or wireless communication devices compatible with one or more different communication protocols. As non-limiting examples, the communication subsystem may be configured for communication via a wireless telephone network, a wireless local area network, a wired local area network, a wireless wide area network, a wired wide area network, etc. In some embodiments, the communication subsystem may allow computing device 500 to send and/or receive messages to and/or from other devices via a network such as the Internet. It is to be understood that the configurations and/or approaches described herein are exemplary in nature, and that these specific embodiments or examples are not to be considered in a limiting sense, because numerous variations are possible. The specific routines or methods described herein may represent one or more of any number of processing strategies. As such, various acts illustrated may be performed in the sequence illustrated, in other sequences, in parallel, or in some cases omitted. Likewise, the order of the above-described processes may be changed. The subject matter of the present disclosure includes all novel and nonobvious combinations and subcombinations of the various processes, systems and configurations, and other features, functions, acts, and/or properties disclosed herein, as well as any and all equivalents thereof. Disclosed herein is a method of tomographic bright field imaging (TBFI): an optical imaging technique that enables the measurement of cellular refractive index and dry mass density using a standard transillumination optical microscope and software embodying said method. 1. A method of imaging a sample illuminated or detected by a light source, the method comprising:
obtaining one or more image cubes; processing the one or more image cubes using a transport of intensity equation; and processing the one or more image cubes using an eikonal equation. 2. The method of processing the one or more image cubes using the convolution theorem. 3. A method of imaging a sample illuminated by a light source of a trans-illumination microscope, the method comprising:
focusing on a first z-plane of the sample; focusing on a second z-plane of the sample; measuring the intensity of the light from the light source, said light passing through the sample at the first z-plane and the second z-plane, thereby creating a set of 2-D measurements of the sample; combining the set of 2-D measurements to form a 3-D image cube; processing the image cube using a TBFI algorithm, said TFBI algorithm comprising a transport of intensity equation (TIE) and an Eikonal equation. 4. The method of 5. The method of 6. The method of 7. The method of 8. The method of 9. The method of 10. The method of 11. The method of 12. The method of 13. Software embodying the method of ACKNOWLEDGEMENT OF GOVERNMENT SUPPORT
FIELD
BACKGROUND
SUMMARY
BRIEF DESCRIPTION OF THE DRAWINGS
DETAILED DESCRIPTION
φ({right arrow over (
{right arrow over (EXAMPLES
Example 1—Three-Dimensional TBFI refractive index reconstructions of polystyrene spheres
Example 2—TBFI refractive index reconstructions of the central focal plane of thicker specimens
Example 3—Determining biological parameters in cellular specimens