NON-SPECTROSCOPIC IMAGING OF PLANTS
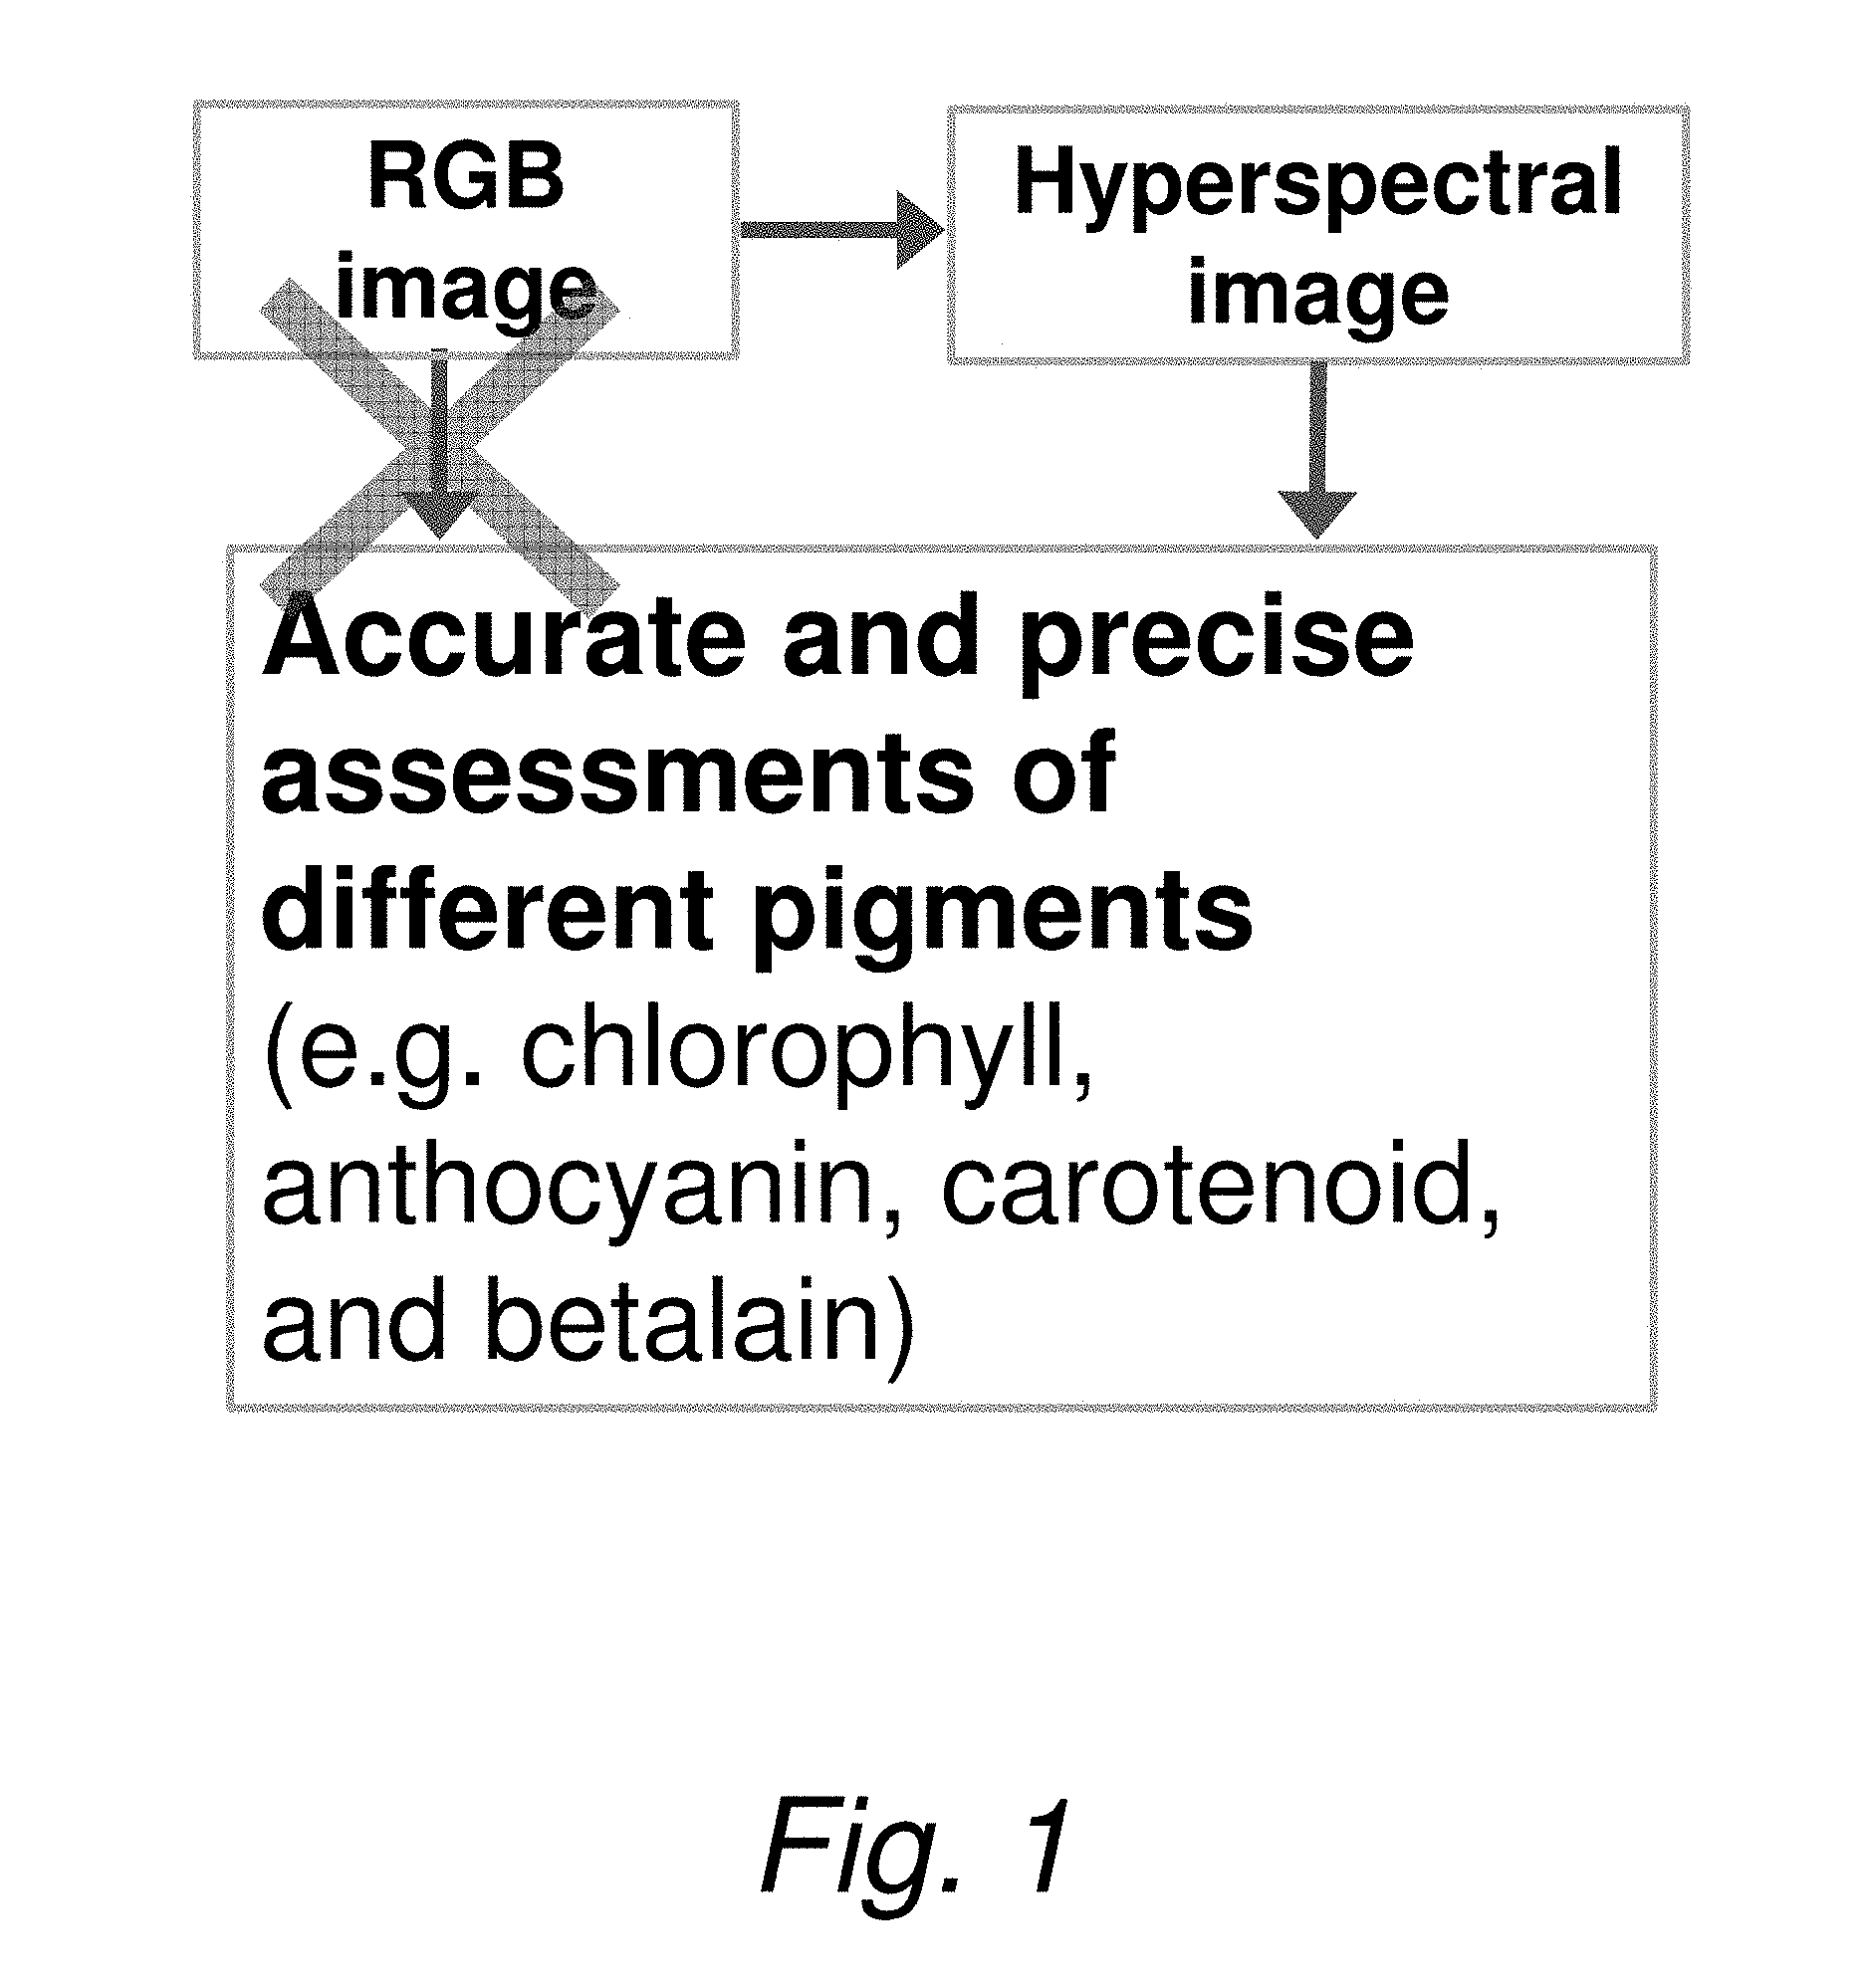
The present patent application is related to and claims the priority benefit of U.S. Provisional Patent Application Ser. No. 62/359,617, filed Jul. 7, 2016, the contents of which is hereby incorporated by reference in its entirety into the present disclosure. The present disclosure generally relates to plant imaging, and in particular to a system and method for nondestructive imaging of physiological changes in plants. This section introduces aspects that may help facilitate a better understanding of the disclosure. Accordingly, these statements are to be read in this light and are not to be understood as admissions about what is or is not prior art. Abiotic and biotic stress (e.g. drought, nutrient deficiency, temperature, and pathogen attack) impacts plant growth and development, eventually influencing crop yield. For example, it is estimated that the extreme drought in 2014 resulted in a revenue loss of $1.5 billion in the California's agricultural economy. Thus, it is critical to assess stress symptoms during early alteration stages before irreversible damage and yield loss occur, allowing for strategic intervention (e.g. rewatering). Loss of chlorophyll is one of the key symptoms that plants display under such stress. In addition, as transgenic breeding becomes widely available, the agricultural industry needs quantitative plant phenotyping technologies for specific selection of pathogen resistant, stress tolerant, and high yielding plants. Overall, there is a strong need for plant imaging technologies that nondestructively and quantitatively visualize stress traits in situ. There are a few methods currently available for quantifying chlorophyll content. Since subtle alterations in chlorophyll are not visible until they reach a certain level, destructive biochemical analyses serve as the gold standard. Optical meters, which quantify chlorophyll content as spot-measurements, are also used as an advanced method, given the nondestructive nature of the technologies. However, these methods provide the level of chlorophyll content in a spot area lacking the information on spatial distribution. In this respect, fluorescent imaging of chlorophyll has received considerable attention as a nondestructive imaging method. Indeed, chlorophyll fluorescence imaging serves as a valuable tool for quantifying leaf photosynthetic efficiency. On the other hand, quantitative assessment using chlorophyll fluorescent signals is intrinsically limited, depending on measurement parameters including excitation illumination and emission detection. Thus, fluorescence signals in plants serve as a proxy measure or an indirect indicator of photosynthesis. There is thus an unmet need for a method and system to accurately and sensitively quantify chlorophyll content, while resolving the spatial heterogeneity. For the purposes of promoting an understanding of the principles of the present disclosure, reference will now be made to the embodiments illustrated in the drawings, and specific language will be used to describe the same. It will nevertheless be understood that no limitation of the scope of this disclosure is thereby intended. For label-free imaging, conventional hyperspectral imaging systems rely on the use of a mechanical filter wheel, an imaging spectrograph, or a liquid crystal tunable filter, all of which limit the development of simple, compact, and cost-effective systems. To build compact and affordable systems for widespread utilization, it is also critical to implement a spectrometerless imaging system. Such a system can be realized by utilizing an algorithm that can reliably reconstruct full spectral information from RGB image data, which are easily acquired by commonly used three-color CCD (or CMOS) cameras. Several methods for spectral reconstruction with RGB data have been studied extensively. The most common methods can be categorized into three groups: Wiener estimation, PCA-based linear models, and multivariate polynomial regression. Thus, these hyperspectral reconstruction methods using RGB data could potentially lead to the simplicity for instrumentation and operation without using bulky and expensive spectrometers. Disclosed herein is a spectrometerless reflectance imaging method that allows for nondestructive and quantitative chlorophyll imaging in individual leaves in situ in a handheld device format. Reflectance spectral patterns can correlate with chlorophyll content in leaves assessed by biochemical analyses. In one embodiment, a laboratory system coupled with an imaging spectrograph with a high spectral resolution is utilized to obtaining a detailed reflectance spectrum in each (x, y) location. In one laboratory example, The herein described mesoscopic hyperspectral imaging system for obtaining experimental spectra from leaf samples, allows acquisition of a matrix of backscattered intensity as a function of x, y, and the wavelength λ of light. The specification includes a transverse resolution of ˜100 μm with a field of view of 152 mm2, an imaging depth of ˜1 mm, and a spectral range of 400-770 nm with a spectral solution of 2 nm. In particular, a back-directional (angular) filtering scheme in the detection part collects the light reflected from the sample within a narrow solid angle of θ=±2° in the exact backward direction. Back-directional angular filtering enhances a spatial resolution and an image contrast by removing a significant amount of unwanted scattered or diffusive light. More importantly, this configuration avoids spectral variations originating from different systems, because reflectance spectra are highly sensitive to illumination and detection geometries. This aspect is crucial to apply the hyperspectral reconstruction algorithm trained by the laboratory system to the spectrometerless imaging system later. In one example, a series of leaf samples from To map out detailed spatial distribution of leaf chlorophyll concentration in the actual unit of μg/mg, a chlorophyll spectral index, and a conversion curve from the spectral index to the value of chlorophyll concentration, and a hyperspectral imaging data set was combined as follows: First, for plant chlorophyll content quantification, the extensively used spectral index for chlorophyll content was exploited, according to Equation (1): where R(λ) is the reflectance intensity. This approach has not yet been used for detailed visualization of chlorophyll content in individual leaves, in part because of the lack of appropriate hyperspectral systems, although this has been used in canopy and remote sensing measurements. Second, the correlation between SI and chlorophyll content was validated, when the reflectance spectra from the entire leaves were averaged and the total chlorophyll content were measured with the biochemical assays. Optical imaging of plants heavily rely on spectrometers, spectrographs, and tunable color filters, all of which significantly limit the development of simple, economical, and lightweight devices. To overcome this limitation, we can mathematically reconstruct spectral information from RGB using a prior hyperspectral data set of interest and the RGB spectral response of the conventional camera. Mathematical reconstruction and prediction of hyperspectral (with a high spectral resolution) imaging are possible using RGB data acquired from conventional RGB cameras. The reconstruction of full spectra from RGB data can be performed using pseudo-inverse, regression, Wiener estimation, and demultiplexing. A hyperspectral reconstruction algorithm is numerically implemented that can reliably predict detailed spectral information from RGB data. Among several different reconstruction methods, polynomial regression is chosen for reconstructing reflectance spectra for optimal performance as follows: First, a reconstruction model is built using a group of training data set (i.e. training stage). To build a model for reconstructing reflectance spectra from RGB data, a RGB camera response v is expressed such that (Equation (2)): where r is the reflectance spectrum and M is the spectral response of the system. In one example, M is obtained from the manufacturer of the three-color CCD (Sony ICX625) that was used in the handheld system (inset in Third, T is determined by applying multivariate polynomial regression. Finally, r is computed. In this step, to determine the best polynomial degree, v was varied such that v=[1, v1, v2, v3, v12, v22, v32] for 2nd-order polynomial regression, which provided highly reliable performance in our plant hyperspectral image data. In another example, the accuracy of the reconstructed spectral information was evaluated, using goodness-of-fit metrics (i.e. coefficient of determination R2 and root mean square error (RMSE)). A predictive ability of the reconstruction model was tested utilizing a leave-one-out cross validation method (i.e. testing stage). Given our relatively small sample size (n=24), leave-one-out cross validation was a reasonable validation method for minimizing over-fitting. The representative spectra in One embodiment of a spectrometerless hyperspectral imaging system 100 is shown In one example, hyperspectral image data and RGB image data was acquired from new This proof-of-concept study demonstrates that the presently disclosed spectrometerless imaging method is capable of nondestructive and quantitative in situ imaging of chlorophyll content on mesoscopic scales. This not only confirms the correlation between the reflectance spectra pattern and the chlorophyll content, but also visualized detailed spatial distribution of chlorophyll content in a whole leaf. Thus, it is expected that spatiotemporal imaging of chlorophyll content may detect early biotic and abiotic stress symptoms of plants. Although the presently disclosed hyperspectral reconstruction is currently applicable for In at least one example embodiment, the herein disclosed system and methods may be used in gardening, crop care, lawn care, and landscape maintenance settings wherein the images and methods can aid in informing users of when to water their plants. The methods and systems can be integrated into currently existing irrigation systems to permit more efficient In another example embodiment, the herein described systems and methods can also be used with a data and image capturing device, for example a smartphone or tablet wherein the images can be captured by the image capturing device in the form of still pictures or a video and the data analyzed. Such a configuration can also permit drone-type imaging and imaging from air to, for example, detect drought or areas where plant watering or nutrient distribution is needed. The devices can also be attached to the plant leafs themselves to permit direct capturing of the images. Those skilled in the art will recognize that numerous modifications can be made to the specific implementations described above. The implementations should not be limited to the particular limitations described. Other implementations may be possible. Those skilled in the art will recognize that high-temporal resolution (e.g. video mode data acquisition) can be made to the specific implementations described above. Monitoring stress symptoms in plants is crucial to maximize crop productivity. Nondestructive imaging of physiological changes in plants has been intensively used as invaluable tools in the agricultural industry. However, this approach requires a bulky and expensive optical instrument for capturing full spectral information and often has intrinsic limitations for quantitative analyses. Disclosed herein are a method and system for spectrometerless hyperspectral imaging that can map out detailed spatial distribution of chlorophyll content, which is a key trait for physiological condition of plants. The combination of a handheld-type imaging system and a hyperspectral reconstruction algorithm offers the simplicity for instrumentation and operation avoiding the use of an imaging spectrograph. This imaging platform can be integrated into a compact, inexpensive, and portable imager for plant biologists and ecophysiologists. 1. A method for spectrometerless imaging of a sample, comprising:
obtaining RGB image data from a sample; applying a hyperspectral reconstruction algorithm to reconstruct the reflectance spectral patterns of the sample from the RGB data; correlating the reflectance spectral patterns with the sample's pigment content and concentration; applying a spectral index of the sample's pigment content; and generating planar images of the sample. 2. The method of 3. The method of 4. The method of 5. The method of 6. The method of 7. The method of 8. The method of 9. The method of 10. The method of 11. The method of 12. A spectrometerless imaging system, comprising:
a detector; a light source; an image capturing device; and a computer processor module, wherein the processor module is configured to: apply a hyperspectral reconstruction algorithm to reconstruct the reflectance spectral patterns of the sample from the RGB data; correlate the reflectance spectral patterns with the sample's pigment content and concentration; apply a spectral index of the sample's pigment content; and generate planar images of the sample. 13. The spectrometerless imaging system of 14. The spectrometerless imaging system of 15. The spectrometerless imaging system of 16. The spectrometerless imaging system of 17. The spectrometerless imaging system of 18. The spectrometerless imaging system of 19. The spectrometerless imaging system of 20. The spectrometerless imaging system of 21. The spectrometerless imaging system of 22. The spectrometerless imaging system of 23. The spectrometerless imaging system of 24. The spectrometerless imaging system of 25. The spectrometerless imaging system of CROSS-REFERENCE TO RELATED APPLICATIONS
TECHNICAL FIELD
BACKGROUND
BRIEF DESCRIPTION OF THE FIGURES
DETAILED DESCRIPTION
SI=[Additional Examples