Spatial-spectral fingerprint spoof detection
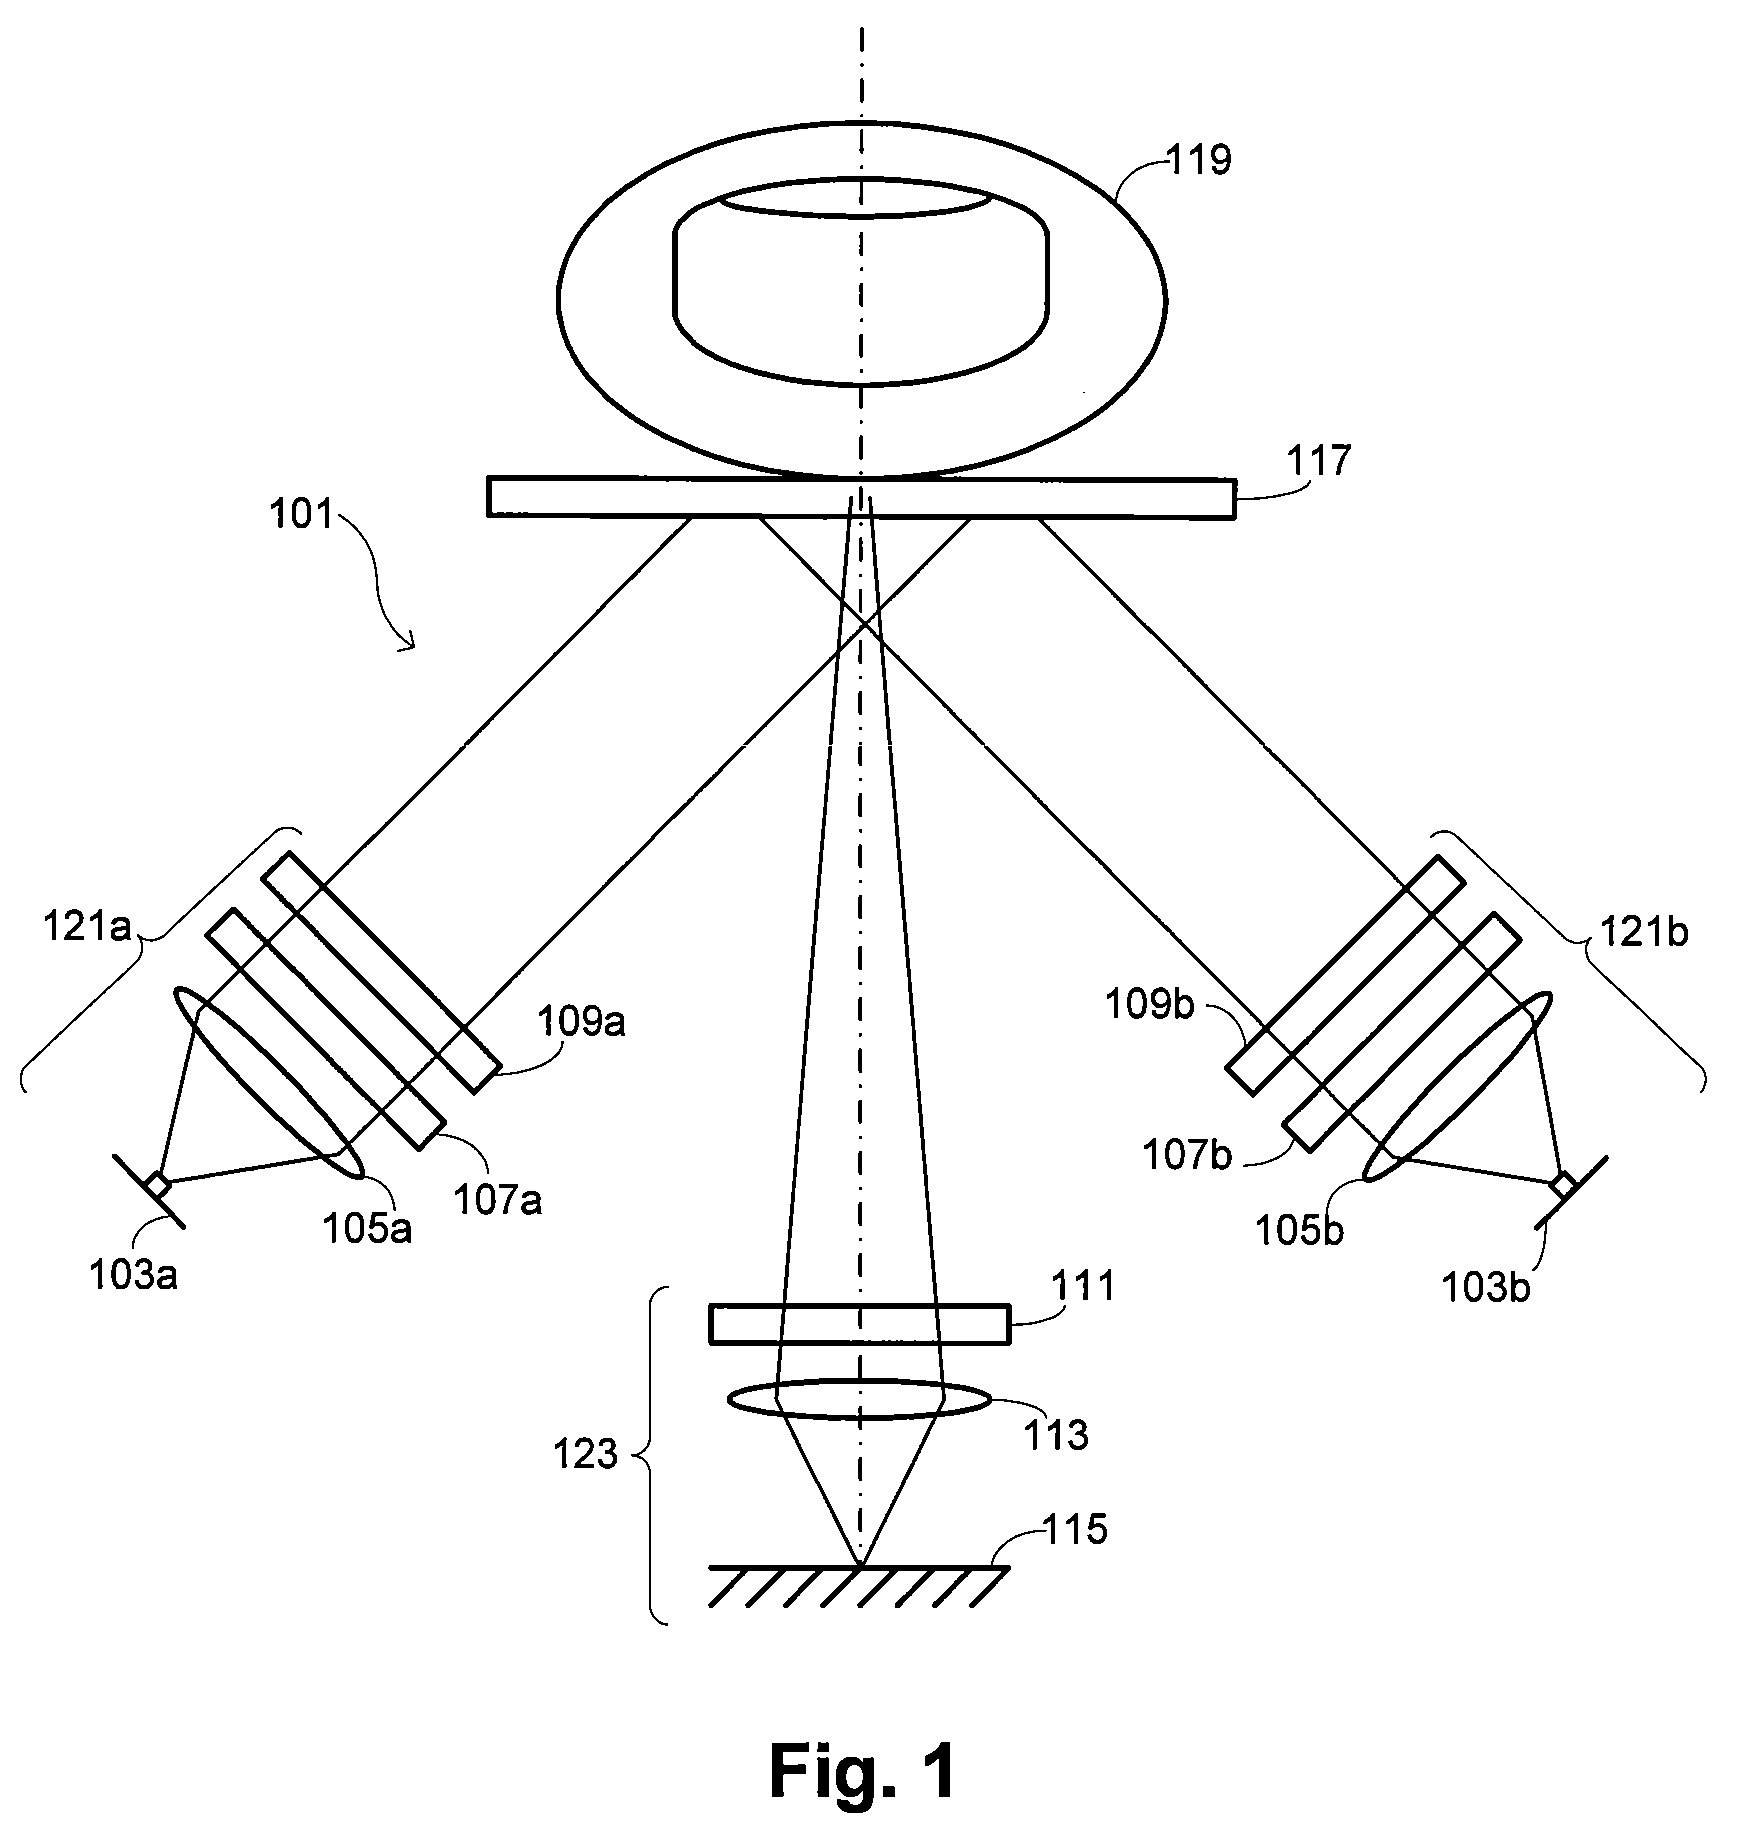
This application is related to concurrently filed, commonly assigned U.S. patent application Ser. No. 11/461,253, entitled “BIOMETRICS WITH SPATIOSPECTRAL SPOOF DETECTION,” the entire disclosure of which is incorporated herein by reference for all purposes. This application relates generally to biometrics. More specifically, this application relates to fingerprint spoof detection. “Biometrics” refers generally to the statistical analysis of characteristics of living bodies. One category of biometrics includes “biometric identification,” which commonly operates under one of two modes to provide automatic identification of people or to verify purported identities of people. Biometric sensing technologies measure the physical features or behavioral characteristics of a person and compare those features to similar prerecorded measurements to determine whether there is a match. Physical features that are commonly used for biometric identification includes faces, irises, hand geometry, vein structure, and fingerprints. The last of these is the most prevalent of all biometric-identification features. Currently, methods for analyzing collected fingerprints include optical, capacitive, radio-frequency, thermal, ultrasonic, and several other less common techniques. Biometric sensors, particularly fingerprint biometric sensors, are generally prone to being defeated by various forms of spoof samples. In the case of fingerprint readers, a variety of methods are known in the art for presenting readers with a fingerprint pattern of an authorized user that is embedded in some kind of inanimate material such as paper, gelatin, epoxy, latex, and the like. Thus, even if a fingerprint reader can be considered to reliably determine the presence or absence of a matching fingerprint pattern, it is also critical to the overall system security to ensure that the matching pattern is being acquired from a genuine, living finger, which may be difficult to ascertain with many common sensors. There is accordingly a general need in the art for methods and systems that permit discrimination between legitimate and spoof presentations of fingerprints. Embodiments of the invention provide methods and systems that may be used in discriminating genuine skin sites presented in biometric applications from spoofs. In a first set of embodiments, methods are provided of deriving a discrimination feature set for use in identifying biometric spoofs. Each of a plurality of true skin sites is illuminated under a plurality of distinct optical conditions. First light reflected from each of the true skin sites is received. True-skin feature values are derived for each of a plurality of features from the received first light to characterize the true skin sites. Each of a plurality of biometric spoofs is similarly illuminated under the plurality of distinct optical conditions. Second light reflected from each of the biometric spoofs is received. Spoof feature values are derived for each of the plurality of features from the received second light to characterize the biometric spoofs. The derived true-skin feature values are compared with the derived spoof feature values to select a subset of the features to define the discrimination feature set. Because the spectral and spatial frequency features or combinations of these features that uniquely distinguish a true skin image from a spoof image may not be readily apparent or identified by visual comparison of the features, some embodiments rely on discriminant-analysis techniques to first train a device to identify spatial and spectral features that are unique to true skin features and spatial and spectral frequency features that are unique to spoof features. A comparison is made of such features to new spectral and spatial frequency data at the time of attempted spoof detection. Discriminant-analysis methods that may be incorporated include those based on Mahalanobis distances, spectral residual magnitudes, K-nearest-neighbor methods, or linear or nonlinear discriminant techniques to compare spectral and spatial frequency data acquired from an individual with spatial and spectral frequency data present in a database. In some embodiments, the true-skin feature values are derived by extracting a plurality of true-skin images from the received first light for each of the true skin sites, and the spoof feature values are derived by extracting a plurality of spoof images from the received second light for each of the biometric spoofs. Each of these true-skin images and each of these spoof images correspond to an image under one of the plurality of distinct optical conditions. Derivation of the true-skin feature values may further comprise a decomposition of the true-skin images into a plurality of different spectral frequency components, with the spoof feature values further being derived by decomposition of each of the spoof images into the plurality of different spectral frequency components. Decomposition into spatial frequency components of each of the true-skin images and of the spoof images may sometimes comprise performing a wavelet decomposition. In addition, in some embodiments, a ratio of first of the different spatial frequency components for the true-skin images to a second of the different spatial frequency components for the true-skin images may be calculated. Similarly, a ratio of a first of the different spatial frequency components for the spoof images to a second of the different spatial frequency components for the spoof images may be calculated. In certain embodiments, an intensity distribution is calculated for each of the different spatial frequency components for the true-skin images and for the spoof images. In such cases, at least one of the features may be substantially invariant to illumination intensity. An example of such an illumination-intensity invariant feature is a ratio of an intensity at a first predetermined percentile of an intensity distribution to a second predetermined percentile of the intensity distribution. In other cases, at least one of the features may vary with illumination intensity. An example of such an illumination intensity variant feature is a different between the intensity at the first determined percentile ad the intensity at the second predetermined percentile. A number of different techniques may be used in different embodiments to compare the derived true-skin feature values with the derived spoof feature values. For example, in one embodiment, the true skin sites and the biometric spoofs define separate classes. The comparison includes calculating rations of within-class variance to between-class variance for a quantity derived from the features. In one instance, the quantity derived from the features comprises a Fisher linear discriminant transform of the features. Selection of the subset of the features may also be performed with a variety of different techniques in different embodiments. Examples of such techniques include learning algorithms like genetic and other algorithms. In a second set of embodiments, methods are provided of performing a biometric function on a purported skin site. The purported skin site is illuminated under a plurality of distinct optical conditions. Light scattered from the purported skin site is received. A feature value for each of a plurality of features is derived from the received light. A comparison is performed of the derived feature value for each of the plurality of features with reference feature values. Whether the purported skin site is a true skin site is accordingly determined from the comparison. Specific techniques similar to those used in deriving the discrimination feature set may also be applied in deriving the feature value. For instance, a plurality of images may be extracted from the received light, with each of the images corresponding to an image under one of the plurality of distinct optical conditions. Each of the plurality of images may be decomposed into a plurality of different spatial frequency components. For instance, the decomposition may be achieved by performing a wavelet decomposition. In one embodiment, a ratio of a first of the different spatial frequency components to a second of the different spatial frequency components is also calculated. An intensity distribution may be calculated for each of the different spatial frequency components. In some cases, at least one of the features is substantially invariant to illumination intensity, such as for a feature that comprises a ratio of an intensity at a first predetermined percentile of the intensity distribution to an intensity at a second predetermined percentile of the intensity distribution. In other cases, at least one of the features varies with illumination intensity, such as for a feature that comprises a different between the intensity at the first predetermined percentile of the intensity distribution and the intensity at the second predetermined percentile of the intensity distribution. In another embodiment, the purported skin site is illuminated under a plurality of distinct optical conditions. Light reflected from the purported skin site is received. The received light is used to perform a biometric identification as well as for determining whether the purported skin site is true skin or a spoof. In cases where it is determined that the purported skin site is not a true skin site, an alarm maybe issued to identify the purported skin site as a spoof. In some embodiments, a biometric identification is also performed from the received light. The methods of the invention may also be embodied on various types of apparatus. For instance, a computer-readable storage medium may be provided having a computer-readable program for directing operation of a computational device. The computational device includes a processor in communication with a storage device. The computer-readable program has instructions for implementing any of the methods described. In other cases, a biometric sensor may be provided. The biometric sensor has an illumination subsystem, a detection subsystem, and a controller. The illumination subsystem is disposed to illuminate a purported skin site of an individual. The detection subsystem is disposed to receive light scattered from the purported skin site. The controller is in communication with the illumination subsystem and with the detection subsystem, and has instructions for implementing any of the methods described above. A further understanding of the nature and advantages of the present invention may be realized by reference to the remaining portions of the specification and the drawings wherein like reference labels are used throughout the several drawings to refer to similar components. In some instances, reference labels include a numerical portion followed by a latin-letter suffix; reference to only the numerical portion of reference labels is intended to refer collectively to all reference labels that have that numerical portion but different latin-letter suffices. 1. Introduction Embodiments of the invention provide methods and systems that may be used to discriminate between legitimate and spoof presentations of fingerprints. As used herein, the term “fingerprints” is intended to refer to any topographical skin feature, irrespective of whether it occurs on a finger or on another part of the body. It is generally expected that applications of the invention will find most utility when applied to topographical features present on the volar surfaces of fingers or hands, but the methods and systems described herein are not restricted to such skin locations and may be applied to other skin locations. Specific examples of skin sites from which “fingerprints” may be extracted thus include all surfaces and all joints of the fingers and thumbs, the fingernails and nail beds, the palms, the backs of the hands, the wrist and forearms, the face, the ears, areas around the eyes, and all other external surfaces of the body. The ability to discriminate between legitimate and spoof presentations of fingerprints according to embodiments of the invention is based on differences in the combined spatial and spectral properties of living skin sites when compared with spoofs. In particular, skin is a complex organ made up of multiple layers, various mixtures of chemicals, and distinct structures such as hair follicles, sweat glands, and capillary beds. The outermost layer of skin, the epidermis, is supported by the underlying dermis and hypodermis. The epidermis itself may have five identified sublayers that include the stratum corneum, the stratum lucidum, the stratum granulosum, the stratum spinosum, and the stratum germinativum. Thus, for example, the skin below the top-most stratum corneum has some characteristics that relate to the surface topography, as well as some characteristics that change with depth into the skin. While the blood supply to skin exists in the dermal layer, the dermis has protrusions into the epidermis known as “dermal papillae,” which bring the blood supply close to the surface via capillaries. In the volar surfaces of the fingers, this capillary structure follows the structure of the friction ridges on the surface. In other locations on the body, the structure of the capillary bed may be less ordered, but is still characteristic of the particular location and person. As well, the topography of the interface between the different layers of skin is quite complex and characteristic of the skin location and the person. While spoofs may sometimes be made with considerable complexity, their structure of skin remains much more complex in both its spectral and spatial properties. In particular, spoofs have much simpler spectral properties and their spatial texture tends to be uniform with spectra. This may be contrasted with skin sites, which provide complex spectral properties in combination with a complex interplay between spatial texture and optical spectra, with nonuniformities existing in a spatial sense in addition to a spectral sense. These differences provide a basis for discrimination that may be embraced by the concept of “chromatic texture.” This is an extension of the concept of “image texture,” which refers generally to any of a large number of metrics that describe some aspect of a spatial distribution of tonal characteristics of an image. For example, some textures, such as those commonly found in fingerprint patterns or wood grain, are flowlike and may be well described by metrics such as an orientation and coherence. “Chromatic texture” extends this concept as a statistical distribution that is additionally a function of spectral frequency. Certain statistical moments such as mean, variance, skew, and kurtosis may be used in quantitative descriptions of texture. Chromatic texture may be manifested by variations in pixel intensities at different spectral frequencies across an image, which may be used in embodiments of the invention to identify spoofs in biometric applications. 2. Data Collection Chromatic texture information may be acquired in embodiments of the invention by collecting an image of a purported skin site under multispectral conditions. As used herein, “multispectral” data refers to data that are collected during a single illumination session under a plurality of distinct optical conditions. The different optical conditions may include differences in polarization conditions, differences in illumination angle, differences in imaging angle, and differences in wavelength. One embodiment of a multispectral biometric sensor that may be used to collect multispectral data is shown in front view in The figure depicts an embodiment in which the illumination subsystem 121 comprises a plurality of illumination subsystems 121 In some instances, the light source 103 may comprise one or more quasimonochromatic sources in which the light is provided over a narrow wavelength band. Such quasimonochromatic sources may include devices such as light-emitting diodes, laser diodes, or quantum-dot lasers. Alternatively, the light source 103 may comprise a broadband source such as an incandescent bulb or glow bar. In the case of a broadband source, the illumination light may pass through a bandpass filter 109 to narrow the spectral width of the illumination light. In one embodiment, the bandpass filter 109 comprises one or more discrete optical bandpass filters. In another embodiment, the bandpass filter 109 comprises a continuously variable filter that moves rotationally or linearly (or with a combination of rotational and linear movement) to change the wavelength of illumination light. In still another embodiment, the bandpass filter 109 comprises a tunable filter element such as a liquid-crystal tunable filter, an acousto-optical tunable filter, a tunable Fabry-Perot filter or other filter mechanism known to one knowledgeable in the art. After the light from the light source 103 passes through the illumination optics 105, and optionally the optical filter 109 and/or polarizer 107, it passes through a platen 117 and illuminates the finger 119 or other skin site. The sensor layout and components may advantageously be selected to minimize the specular reflection of the illumination into the detection optics 113. In one embodiment, such specular reflections are reduced by relatively orienting the illumination subsystem 121 and detection subsystem 123 such that the amount of directly reflected light detected is minimized. For instance, optical axes of the illumination subsystem 121 and the detection subsystem 123 may be placed at angles such that a mirror placed on the platen 117 does not reflect an appreciable amount of illumination light into the detection subsystem 123. In addition, the optical axes of the illumination and detection subsystems 121 and 123 may be placed at angles relative to the platen 117 such that the angular acceptance of both subsystems is less than the critical angle of the system; such a configuration avoids appreciable effects due to total internal reflectance between the platen 117 and the skin site 119. An alternative mechanism for reducing the specular reflected light makes use of optical polarizers. Both linear and circular polarizers can be employed advantageously to make the optical measurement more sensitive to certain skin depths, as known to one familiar in the art. In the embodiment illustrated in The detection subsystem 123 may incorporate detection optics that comprise lenses, mirrors, and/or other optical elements that form an image of the region near the platen surface 117 onto the detector 115. The detection optics 113 may also comprise a scanning mechanism (not shown) to relay portions of the platen region onto the detector 115 in sequence. In all cases, the detection subsystem 123 is configured to be sensitive to light that has penetrated the surface of the skin and undergone optical scattering within the skin and/or underlying tissue before exiting the skin. The illumination subsystem 121 and detection subsystem 123 may be configured to operate in a variety of optical regimes and at a variety of wavelengths. One embodiment uses light sources 103 that emit light substantially in the region of 400-1000 nm; in this case, the detector 115 may be based on silicon detector elements or other detector material known to those of skill in the art as sensitive to light at such wavelengths. In another embodiment, the light sources 103 may emit radiation at wavelengths that include the near-infrared regime of 1.0-2.5 μm, in which case the detector 115 may comprise elements made from InGaAs, InSb, PbS, MCT, and other materials known to those of skill in the art as sensitive to light at such wavelengths. The structure of the device illustrated in Furthermore, a multispectral biometric sensor like that illustrated in Operation of the multispectral sensor may be coordinated with a computational system like that shown schematically in The computational device 200 also comprises software elements, shown as being currently located within working memory 220, including an operating system 224 and other code 222, such as a program designed to implement methods of the invention. It will be apparent to those skilled in the art that substantial variations may be used in accordance with specific requirements. For example, customized hardware might also be used and/or particular elements might be implemented in hardware, software (including portable software, such as applets), or both. Further, connection to other computing devices such as network input/output devices may be employed. 3. Data Analysis The potential for spoofs to be effective in circumventing conventional biometric analyses is illustrated with a Identification of Discrimination Features The method begins at block 404 with the illumination of a true skin site under multispectral conditions, as may be performed using a multispectral biometric sensor like that described above. The collected data may be considered to define a multispectral dataset that permits extraction of information along a number of independent variables. The multispectral dataset is sometimes referred to as a “multispectral datacube,” but this terminology is not intended to suggest any particular limit on the number of independent variables embraced by the dataset; the number of independent variables depends on the number of different factors used in generating the different optical conditions defining the multispectral conditions under which data are collected and may vary among different embodiments. As indicated at block 408, a plurality of image frames are extracted from the multispectral datacube to correspond to different optical conditions. This is illustrated schematically in Each of the image frames is decomposed into different spatial frequency components at block 412. There are a number of different ways in which such a decomposition may be accomplished in different embodiments. In certain embodiments, a wavelet transform is applied to each of the image frames. This may be done in embodiments that use a discrete wavelet transform by applying high-pass and low-pass filters to the image frames as illustrated in At each decomposition level, the filters produce signals that span a portion of the original frequency range. In the illustration of The particular form of the high-pass and low-pass filters 604 and 608 may vary in different embodiments. For example, in one embodiment where Haar transforms are implemented, the high-pass filter 604 effectively acts to determine a difference between adjacent pixels of the input image while the low-pass filter 608 effectively acts to determine an average between adjacent pixels. Other examples of transforms that may be implemented with discrete wavelets, and which are well-known to those of skill in the art, include Daubechies transforms, Coiflet transforms, Symlet transforms, Meyer transforms, Morlet transforms, and mexican-hat transforms, among others. The implementation of these and other transforms are also within the scope of the invention. In particular embodiments, the frequency decomposition performed at block 412 is performed with a dual-tree complex wavelet transform, details of which are provided in Nick Kingsbury, “Complex Wavelets for Shift Invariant Analysis and Filtering of Signals,” J. Appl. Comp. Harmonic Analysis, 10, 234 (2001), the entire disclosure of which is incorporated herein by reference for all purposes. Briefly, the extension of wavelet analysis to a complex domain increases the dimensionality of the analysis. Instead of outputting two images by the application of filters, each level of decomposition produces four images equal in size to the input image for that level, with the lowest-frequency image becoming the input for the next level. Each of the images is constructed using different row and column filters, so that the output images are themselves provided in the form of four component images, each of which is one quarter the size of the input image. In each instance, the four component images are encoded in pixel quads. This technique advantageously has the property that it is relatively spatially invariant, particularly in comparison with a variety of other types of techniques. Other examples of techniques that may be used to effect the frequency decomposition in different embodiments include the use of moving-window Fourier transforms and the application of Gabor filters, among a variety of different techniques known to those of skill in the art. Returning to In addition to scalar features that are ratios of percentile values, other arithmetic combinations of percentile values may be used as scalar features. These other arithmetic combinations may in some instances not be invariant to illumination intensity, but may nonetheless sometimes provide valuable discriminant information. Merely by way of example, one scalar feature that may be determined for each of the decomposed images is the ratio of the intensity of the image at percentile 0.30 to the intensity of the image at percentile 0.70. Another scalar feature that may be determined is the sum of the intensity of the image at percentile 0.30 with the intensity of the image at percentile 0.70. The use of 0.30 and 0.70 percentiles in these examples is made purely for illustrative purposes. In other instances, different percentile values may be used. Also, the invention is not limited by the number of scalar features derived from each of the images. In some instances, only a single feature might be derived from each image, while other embodiments may derive a plurality of features. Furthermore, it is not necessary that scalar features be derived from every image that results from the decomposition. In some embodiments, scalar features are extracted from a subset of the decomposed images. Also, while the example discussed herein make use of scalar features, it is possible in alternative embodiments to define features that have a multidimensional quality, or to combine the scalar features into a multidimensional vector. The method embraced by blocks 404-416 of A similar procedure may be applied to multiple spoofs, with the various spoofs preferably having diverse characteristics representative of the types of spoofs that might be attempted. The same basic methodology is applied to the spoofs as was applied to the skin sites. At block 424, a particular spoof is illuminated under multispectral conditions. These multispectral conditions may be substantially the same multispectral conditions under which the true skin sites were illuminated at block 404. A plurality of image frames of the spoof that correspond to different optical conditions are extracted from the resulting datacube at block 428. Each of the image frames is decomposed into different frequency components at block 432 and an intensity distribution feature set is calculated from each frame at block 436. These steps may be performed using the same techniques applied to the true skin sites, and may be performed for a number of different spoofs as indicated with the check performed at block 440. After feature sets have been generated from both skin sites and from spoofs, a discriminant model is applied at block 444 to determine discriminating features from the feature sets. There are a number of different types of discriminant models that may be applied in different embodiments. Certain embodiments make use of the recognition by the inventors that, on average, spoof and true skin sites will have different intensity distributions. This is a consequence of the different structural characteristics that distinguish living tissue and are manifested in both spectral and spatial variations. For any particular feature, the variance between spoof classes and a true skin-site class is expected to be small relative to the within-class variances. Thus, one measure of the discriminating power of the derived features is the ratio of within-class variance to between-class variance. In certain embodiments, this ratio is thus calculated directly when applying the discriminant model at block 444. For example, applying steps 404-416 for a particular true skin site may provide a number of feature values t1(1), t2(1), . . . , tN(1), where N is the number of features. Representing this set of feature values as an N-dimensional vector {right arrow over (t)}(1), the set of features for all the measurements on true skin sites may be represented by the set of vectors {right arrow over (t)}(1), {right arrow over (t)}(2), . . . , {right arrow over (t)}(M In other embodiments, a Fisher linear discriminant may be applied to transform the raw derived features into a new set of features. This is accomplished by applying a transform T to the feature sets {right arrow over (t)} and {right arrow over (s)} to produce new feature sets
In many instances, it is expected that a subset of the features or transformed features will be sufficient to provide discrimination between true skin samples and spoofs. Part of applying the discriminant model at block 444 may thus include making a selection of a subset of the features or transformed features having sufficient discriminatory power, in some instances being those features that provide the best discriminatory power. There are a number of techniques that may be used in different embodiments for selection of the subset of features, including the use of genetic algorithms, neural networks, expert systems, simulated annealing, and any of a variety of artificial-intelligence techniques that may permit identification of those features having the desired discriminatory power. Such techniques are sometimes referred to collectively herein as “learning algorithms.” The application of such techniques is generally well known to those of skill in this art. For example, a genetic algorithm functions by creating a population of feature sets, with each set being a subset of the total available features. The spoof-detection performance of each member of the population is determined. The best-performing members are selected and a new population generated by splitting and combining the feature sets of the best performers. This process is repeated until performance stops improving, with the resultant population defining the desired feature sets. Such a method is described as “genetic” in analogy to biological systems. The splitting and combining of feature sets is analogous to biological reproduction of cells and the selection of the best performing members is analogous to biological selection in reproductive processes. The method of This calculation of two scalar features from each of the 32 subimages provides a total of 64 scalar features that may be subjected to a discriminant model. In this instance, the 64 scalar features were organized into eight groups, each of which has eight members to correspond to the eight image planes extracted from the multispectral data. This grouping is illustrated in Table I. In this table, “P30” refers to the intensity at the 0.30 percentile and “P70” refers to the intensity of the 0.70 percentile. The ratio of within-class to between-class variance for these raw features is shown in the results of In this instance, discrimination power is ever more concentrated in just a few features. Indeed, after transformation, the vast majority of the features have little discrimination power, which is instead concentrated in the last three features. This suggests that discrimination between a true skin site and a spoof may be accomplished using only three transformed features. In fact, even just two of the transformed features prove to be sufficient. This is illustrated in b. Classification of Measurements Once the system has been trained as described above, it may be used in biometric applications to identify possible spoofs. A summary is provided with the flow diagram of The method begins at block 1404 by illuminating a purported skin site under multispectral conditions, with the method attempting to classify the purported skin site as a true skin site or as a spoof. As previously noted, the multispectral data that are collected may advantageously be used for biometric identification, but this is not a requirement of the invention and the methods for classifying the purported skin site may be used in conjunction with any type of biometric identification method, or may be used in isolation for certain specialized applications. A plurality of image frames of the purported skin site are extracted from the multispectral data at block 1408. These image frames correspond to different optical conditions, such as different illumination wavelengths, different polarization conditions, different illumination and/or detection angles, and the like. Each frame is decomposed into different frequency components at block 1412, usually using the same type of decomposition that was used in initial training of the system. The intensity distribution for a discriminating feature set is calculated at block 1416. The discriminating feature set is generally a subset of the feature set that was initially analyzed during training and corresponds to a set that includes those features determined to have the desired discriminatory power. These features may comprise raw features or transformed features in different embodiments. For instance, in a system trained with the input data used in the example described above, the discriminating feature set might consist of features numbered 62, 63, and 64 since these provided virtually all of the discriminatory power. Under different training scenarios, other features might be included in the discriminating feature set. The specific selection of a subset of features may be useful for a number of reasons. It may reduce the processing time required to perform classifications after the system has been trained. In addition, those features that have relatively low discrimination power could add more noise to the classification and increase the spoof-detection errors. Exclusion of such features from the method may thus improve both the speed and reliability of classifications. The values calculated for the discriminating feature set are used at block 1420 to perform a comparison with the standard feature-set classes to assign the purported skin site to a spoof or nonspoof classification at block 1424. Such a comparison may proceed in different ways in different embodiments. For instance, results like those shown in In other cases, statistical techniques may be used to perform a comparison of the results calculated at block 1416 with the training results to determine a confidence level that the purported skin site is a true skin site. The use of statistical techniques in this way permits the sensitivity of the method to be adjusted. For instance, relatively low-security applications might permit validation of a purported skin site whenever the confidence that it is consistent with a true skin site is greater than a 75% confidence level; conversely, very-high-security applications might impose a confidence level requirement of 99%, with intermediate applications using intermediate confidence levels. If the purported skin site is classified as a spoof as checked at block 1428, an alarm may be issued to prompt further action. The alarm may take the form of an audible or visible alarm in different embodiments, or may take the form of restricting activity of the person presenting the purported skin site. In some instances, the alarm may initiate further investigation of the purported skin site, the activation of law-enforcement personnel, or any of a variety of other responses, depending on the specific application. In some instances, a check may be made to verify whether the determination of the system was correct. That information may be used for additional training of the system, particularly in those cases where the determination was erroneous either because it identified a true skin site as a spoof or identified a spoof as a true skin site. A check may accordingly be made in some embodiments at block 1436, prompting a calculation of the full intensity distribution feature set for the purported skin site at block 1440. Such a calculation is not restricted to the discriminating feature set, but instead duplicates the type of calculation performed at blocks 416 and 436 of The inventors extended the example described above to test classification accuracy. Table II below summarizes classification errors that may be associated with different feature groups. In one column, results are presented for classification errors that result when a particular group is excluded and all other groups are included. This is contrasted with results in another column for classifications that result when only a particular group is included. Table III below provides results that compare classification errors for features that are insensitive to illumination level with those that are sensitive to illumination level. Thus, having described several embodiments, it will be recognized by those of skill in the art that various modifications, alternative constructions, and equivalents may be used without departing from the spirit of the invention. Accordingly, the above description should not be taken as limiting the scope of the invention, which is defined in the following claims. Methods and apparatus are provided of deriving a discrimination feature set for use in identifying biometric spoofs. True skin sites are illuminated under distinct optical conditions and light reflected from each of the true skin sites is received. True-skin feature values are derived to characterize the true skin sites. Biometric spoofs is similarly illuminated under the distinct optical conditions and light reflected from the spoofs is received. Spoof feature values are derived to characterize the biometric spoofs. The derived true-skin feature values are compared with the derived spoof feature values to select a subset of the features to define the discrimination feature set. 1. A method of deriving a discrimination feature set for use in identifying biometric spoofs, the method comprising:
illuminating each of a plurality of true skin sites under a plurality of distinct optical conditions; extracting true images from light received from each of the plurality of true skin sites, wherein the true images comprise spatially-distributed multispectral images; deriving true-skin feature values for each of a plurality of features from the true images to characterize the true skin sites; illuminating each of a plurality of biometric spoofs under the plurality of distinct optical conditions; extracting spoof images from light received from each of the biometric spoofs, wherein the spoof images comprise spatially-distributed multispectral images; deriving spoof feature values for each of the plurality of features from the spoof images to characterize the biometric spoofs; and comparing the derived true-skin feature values with the derived spoof feature values to select a subset of the features to define the discrimination feature set. 2. The method recited in each of the true-skin images and each of the spoof images corresponds to an image under one of the plurality of distinct optical conditions. 3. The method recited in deriving the true-skin feature values further comprises decomposing each of the true-skin images into a plurality of different spectral frequency components; and deriving the spoof feature values further comprises decomposing each of the spoof images into the plurality of different spectral frequency components. 4. The method recited in 5. The method recited in deriving the true-skin feature values further comprises calculating a ratio of a first of the different spatial frequency components for the true-skin images to a second of the different spatial frequency components for the true-skin images; and deriving the spoof feature values further comprises calculating a ratio of a first of the different spatial frequency components for the spoof images to a second of the different spatial frequency components for the spoof images. 6. The method recited in deriving the true-skin feature values further comprises calculating an intensity distribution for each of the different spatial frequency components for the true-skin images; and deriving the spoof feature values further comprises calculating an intensity distribution for each of the different spatial frequency components for the spoof images. 7. The method recited in 8. The method recited in 9. The method recited in 10. The method recited in the at least one of the features comprises a ratio of an intensity at a first predetermined percentile of an intensity distribution to an intensity at a second predetermined percentile of the intensity distribution; and the at least a second of the features comprises a difference between the intensity at the first predetermined percentile and the intensity at the second predetermined percentile. 11. The method recited in 12. The method recited in the true skin sites and the biometric spoofs define separate classes; and comparing the derived true-skin feature values with the derived spoof feature values comprises calculating ratios of within-class variance to between-class variance for a quantity derived from the features. 13. The method recited in 14. The method recited in 15. The method recited in 16. A computer-readable storage medium having a computer-readable program embodied therein for directing operation of a computational device to derive a discrimination feature set for use in identifying biometric spoofs, the computational device including a processor in communication with a storage device, the computer-readable program including:
instructions for retrieving, with the processor from the storage device, first data representing properties of first light reflected from each of a plurality of true skin sites under a plurality of distinct optical conditions; instructions for extracting a plurality of true-skin image representations from the first data for each of the true skin sites, wherein the true-skin images are spatially-distributed multispectral images; instructions for retrieving, with the processor from the storage device, second data representing properties of second light reflected from each of a plurality of biometric spoofs; instructions for extracting a plurality of spoof image representations from the second data for each of the biometric spoofs, wherein the spoof image representations comprise spatially distributed multispectral images; and instructions for comparing, with the processor, the derived true-skin feature values with the derived spoof feature values to select a subset of the features to define the discrimination feature set. 17. The computer-readable storage medium recited in each of the true-skin image representations and spoof image representations corresponds to an image under one of the plurality of distinct optical conditions. 18. The computer-readable storage medium recited in the instructions for deriving the true-skin feature values further comprise instructions for decomposing each of the true-skin image representations into a plurality of different spatial frequency components; and the instructions for deriving the spoof feature values further comprise instructions for decomposing each of the spoof image representations into the plurality of different spatial frequency components. 19. The computer-readable storage medium recited in 20. The computer-readable storage medium recited in the instructions for deriving the true-skin feature values further comprise instructions for calculating a ratio of a first of the different spatial frequency components for the true-skin image representations to a second of the different spatial frequency components for the true-skin image representations; and the instructions for deriving the spoof feature values further comprise instructions for calculating a ratio of a first of the different spatial frequency components for the spoof image representations to a second of the different spatial frequency components for the spoof image representations. 21. The computer-readable storage medium recited in the instructions for deriving the true-skin feature values further comprise instructions for calculating an intensity distribution for each of the different spatial frequency components for the true-skin image representations; and the instructions for deriving the spoof feature values further comprise instructions for calculating an intensity distribution for each of the different spatial frequency components for the spoof image representations. 22. The computer-readable storage medium recited in 23. The computer-readable storage medium recited in 24. The computer-readable storage medium recited in 25. The computer-readable storage medium recited in the at least one of the features comprises a ratio of an intensity at a first predetermined percentile of an intensity distribution to an intensity at a second predetermined percentile of the intensity distribution; and the at least a second of the features comprises a different between the intensity at the first predetermined percentile and the intensity at the second predetermined percentile. 26. The computer-readable storage medium recited in 27. The computer-readable storage medium recited in the true skin sites and the biometric spoofs define separate classes; and the instructions for comparing the derived true-skin feature values with the derived spoof feature values comprise instructions for calculating ratios of within-class variance to between-class variance for a quantity derived from the features. 28. The computer-readable storage medium recited in 29. The computer-readable storage medium recited in 30. The computer-readable storage medium recited in CROSS REFERENCE TO RELATED APPLICATION
BACKGROUND OF THE INVENTION
BRIEF SUMMARY OF THE INVENTION
BRIEF DESCRIPTION OF THE DRAWINGS
DETAILED DESCRIPTION OF THE INVENTION
the mean of the spoof feature values is
and the mean of the entire set of feature values is
The within-class variance is
and the between-class variance is
permitting calculation of the ratio as
for each feature j.
{right arrow over (t)}′=T{right arrow over (t)} and {right arrow over (s)}′=T{right arrow over (s)}.
The transform is an N×N matrix that may be expressed as T=[{right arrow over (e)}1, {right arrow over (e)}2, . . . , {right arrow over (e)}N], where the set of {right arrow over (e)} vectors are generalized eigenvectors of the between-class and within-class scattering matrices
The same type of calculation as described above for the raw feature values may be performed with the transformed feature values to calculate a ratio of the within-class variance to the between-class variance. This transform advantageously maximizes such a ratio, thereby enhancing the discrimination power of the discriminant model.
EXAMPLE
1-8 P30/P70 for medium-frequency/low-frequency ratio 9-16 P30 + P70 for medium-frequency/low-frequency ratio 17-24 P30/P70 for high frequency 25-32 P30 + P70 for high frequency 33-40 P30/P70 for medium frequency 41-48 P30 + P70 for medium frequency 49-56 P30/P70 for low frequency 57-64 P30 + P70 for low frequency EXAMPLE
Classification Error (%) Group Only Feature Group Excluded Group Included Medium-frequency/low-frequency ratio 1.9 15.0 High frequency 1.7 11.0 Medium frequency 1.5 14.7 Low frequency 2.7 5.3 All Data 1.4
These results confirm the general result that lower-frequency features generally provide greater discriminatory power.
P30, P70 2.4 None (All frequency decomposition levels) P30/P70 9.6 Global (All frequency decomposition levels) P30, P70, P30/P70 12.9 Global and local (Ratio of frequency decomposition levels) All features 1.4 Mixed
While it is generally desirable that features be insensitive to illumination intensity, the results of Table III show that the insensitive features may not be as powerful as the features that have some sensitivity to illumination intensity. It may thus be advantageous in some embodiments to have a feature set that includes both features that are insensitive to illumination intensity and features that have some sensitivity to illumination intensity.


CPC - классификация
GG0G06G06FG06F1G06F18G06F18/G06F18/2G06F18/21G06F18/213G06F18/2132G06KG06K9G06K9/G06K9/0G06K9/00G06K9/000G06K9/0004G06K9/009G06K9/0090G06K9/00906G06K9/2G06K9/20G06K9/201G06K9/2018G06K9/6G06K9/62G06K9/623G06K9/6234G06VG06V1G06V10G06V10/G06V10/1G06V10/14G06V10/143G06V10/5G06V10/58G06V4G06V40G06V40/G06V40/1G06V40/13G06V40/131G06V40/1318G06V40/4G06V40/45Цитирование НПИ
Anderson, C. E. et al., “Fundamentals of Calibration Transfer Through Procrustes Analysis,” Appln. Spectros., vol. 53, No. 10 (1999) p. 1268-1276.Ashboum, Julian, Biometrics; Advanced Identity Verification, Springer, 2000, pp. 63-4).
Bantle, John P. et al., “Glucose Measurement In Patients With Diabetes Mellitus With Dermal Interstitial Fluid,” Mosby-Year Book, Inc., 9 pages, 1997.
Berkoben, Michael S. et al., “Vascular Access For Hemodialysis,” Clinical Dialysis, Third Edition, pp. 2 cover pages and 26-45, 1995.
Blank, T.B. et al., “Transfer of Near-Infrared Multivariate Calibrations Without Standards,”Anal. Chem., vol. 68 (1996) p. 2987.
Bleyer, Anthony J. et al., “The Costs of Hospitalizations Due to Hemodialysis Access Management,” Nephrology News & Issues, pp. 19, 20 and 22, Jan. 1995.
Brasunas John C. et al., “Uniform Time-Sampling Fourier Transform Spectroscopy,” Applied Optics, vol. 36, No. 10, Apr. 1, 1997, pp. 2206-2210.
Brault, James W., “New Approach to High-Precision Fourier Transform Spectrometer Design,” Applied Optics, Vo. 35, No. 16, Jun. 1, 1996, pp. 2891-2896.
Cassarly, W.J. et al., “Distributed Lighting Systems: Uniform Light Delivery,” Source Unknown, pp. 1698-1702, 1995.
Chang, Chong-Min et al., “An Uniform Rectangular Illuminating Optical System for Liquid Crystal Light Valve Projectors,” Euro Display '96 (1996) pp. 257-260.
Coyne, Lawrence J. et al., “Distributive Fiber Optic couplers Using Rectangular Lightguides as Mixing Elements,” (Information Gatekeepers, Inc. Brookline, MA, 1979) pp. 160-164.
Daugirdas, JT et al., “Comparison Of Methods To Predict The Equilibrated Kt/V (eKt/V) In The Hemo Study,” National Institutes of Health, pp. 1-28, Aug. 20, 1996.
Demos, S. G. et al., “Optical Fingerprinting Using Polarisation Contrast Improvement,” Electronics Letters, vol. 33, No. 7, pp. 582-584, Mar. 27, 1997.
Depner, Thomas A. et al., “Clinical Measurement Of Blood Flow In Hemodialysis Access Fistulae And Grafts By Ultrasound Dilution,” Division of Nephrology, University of California, pp. M745-M748, published on or before Oct. 30, 1997.
Despain, Alvin M. et al., “A Large-Aperture Field-Widened Interferometer-Spectrometer for Airglow Studies,” Aspen International Conference on Fourier Spectroscopy, 1970, pp. 293-300.
Faber, Nicolaas, “Multivariate Sensitivity for the Interpretation of the Effect of Spectral Pretreatment Methods on Near-Infrared Calibration Model Predictions,” Analytical Chemistry, vol. 71, No. 3, Feb. 1, 1999, pp. 557-565.
Fresenius USA, “Determination Of Delivered Therapy Through Measurement Of Effective Clearance,” 2 pages, Dec. 1994.
Geladi, Paul et al., “A Multivariate NIR Study of Skin Alterations in Diabetic Patients as Compared to Control Subj ects,”J. Near Infrared Spectrosc., vol. 8 (2000) pp. 217-227.
Hakim, Raymond M. et al., “Effects Of Dose Of Dialysis On Morbidity and Mortality,” American Journal of Kidney Diseases, vol. 23, No. 5, pp. 661-669, May 1994.
Jacobs, Paul et al., “A Disposable Urea Sensor For Continuous Monitoring Of Hemodialysis Efficiency,” ASAIO Joumal, pp. M353-M358, 1993.
Keshaviah, Prakash R. et al., “On-Line Monitoring Of The Delivery Of The Hemodialysis Prescription,” Pediatric Nephrology, vol. 9, pp. S2-S8, 1995.
Krivitski, Nikolai M., “Theory And Validation Of Access Flow Measurement By Dilution Technique During Hemodialysis,” Kidney International, vol. 48, pp. 244-250, 1995.
Lee et al., “Fingerprint Recognition Using Principal Gabor Basis Function”, Proceedings of 2001 International Symposium on Intelligent Multimedia, Video and Speech Processing, May 2-4, 2001, Sections 2-3.
Marbach, Ralf, “Measurement Techniques For IR Spectroscopic Blood Glucose Determination,” Fortschritt Bericht, Series 8: Measurement And Control Technology, No. 346, pp. cover and 1-158, Mar. 28, 1994.
Mardia, K.V. et al., “Chapter 11—Discriminant Analysis,” Multivariate Analysis, pp. 2 cover pages and 300-325, 1979.
Nichols, Michael G. et al., “Design And Testing Of A White-Light, Steady-State Diffuse Reflectance Spectrometer For Determination Of Optical Properties Of Highly Scattering Systems,” Applied Optics, vol. 36, No. 1, pp. 93-104, Jan. 1, 1997.
Nixon, Kristin A. et al., “Novel Spectroscopy-Based Technology for Biometric and Liveness Verification”, Technology for Human Identification. Proceedings od SPIE, vol. 5404, No. 1, XP-002458441, Apr. 12-13, 2004, pp. 287-295 (ISSN: 0277-786x).
PCT International Search Report mailed Sep. 29, 2008, Application No. PCT/US07/74747, 8 pages.
Pan et al., “Face Recognition in Hyperspectral Images”, IEEE Transactions on Pattern Analysis and Machine Intelligence vol. 25, No. 12, Dec. 2003.
Ripley, B. D., “Chapter 3—Linear Discriminant Analysis,” Pattern Recognition And Neural Networks, pp. 3 cover pages and 91-120, 1996.
Ronco, C. et al., “On-Line Urea Monitoring : A Further Step Towards Adequate Dialysis Prescription And Delivery,” The International Journal of Artificial Organs, vol. 18, No. 9, pp. 534-543, 1995.
Ross et al., “A Hybrid Fingerprint Matcher,” Pattern Recognition 36, The Journal of the Pattern Recognition Society, 2003 Elsevier Science Ltd., pp. 1661-1673.
Selvaraj et al., Fingerprint Verification Using Wavelet Transform, Proceedings of the Fifth International Conference on Computational Intelligence and Multimedia Applications, IEEE, 2003.
Service, F. John et al., “Dermal Interstitial Glucose As An Indicator Of Ambient Glycemia,” Diabetes Care, vol. 20, No. 9, 8 pages, Aug. 1997.
Sherman, Richard A., “Chapter 4—Recirculation In The Hemodialysis Access,” Principles and Practice Of Dialysis, pp. 2 cover pages and 38-46, 1994.
Sherman, Richard A., “The Measurement Of Dialysis Access Recirculation,” American Journal of Kidney Diseases, vol. 22, No. 4, pp. 616-621, October 1993.
Steuer, Robert R. et al., “A New Optical Technique For Monitoring Hematocrit And Circulating Blood Volume: Its Application In Renal Dialysis,” Dialysis & Transplantation, vol. 22, No. 5, pp. 260-265, May 1993.
Webb, Paul, “Temperatures Of Skin, Subcutaneous Tissue, Muscle And Core In Resting Men In Cold, Comfortable And Hot Conditions,” European Journal of Applied Physiology, vol. 64, pp. 471-476, 1992.
Zavala, Albert et al., “Using Fingerprint Measures To Predict Other Anthropometric Variables,” Human Factors, vol. 17, No. 6, pp. 591-602, 1975.
de Noord, Onno E., “Multivariate Calibration Standardization,” Chemometrics and intelligent Laboratory Systems 25, (1994) pp. 85-97.